Fire islands exhibit higher coarse woody debris volume compared to harvest islands
The coarse woody debris volume distribution resulted that fire islands exhibited higher coarse woody debris volume. The distance 15 m from the edge in harvest islands show a higher CWD volume unlike from other plot distances in the islands. This is due to the blowdown experienced by north facing harvest islands particularly. All the north facing islands had high tree mortality and recently dead downed trees contributes to the coarse woody debris volume. Most of the pieces were medium to large (20 cm and above) which positively affected the CWD volume. Moreover clean edges in the harvest islands can also substantiate this result. In the case of disturbances, fire displays a higher coarse woody debris throughout the transect distances, it is because fire disturbance plots consist of recently dead trees(snags) and a high amount of woody debris due to the fire. For more significant understanding, standard error test in both islands and disturbances are done.
LINEAR MODEL AND STANDARD ERROR ESTIMATES FROM EMMEANS
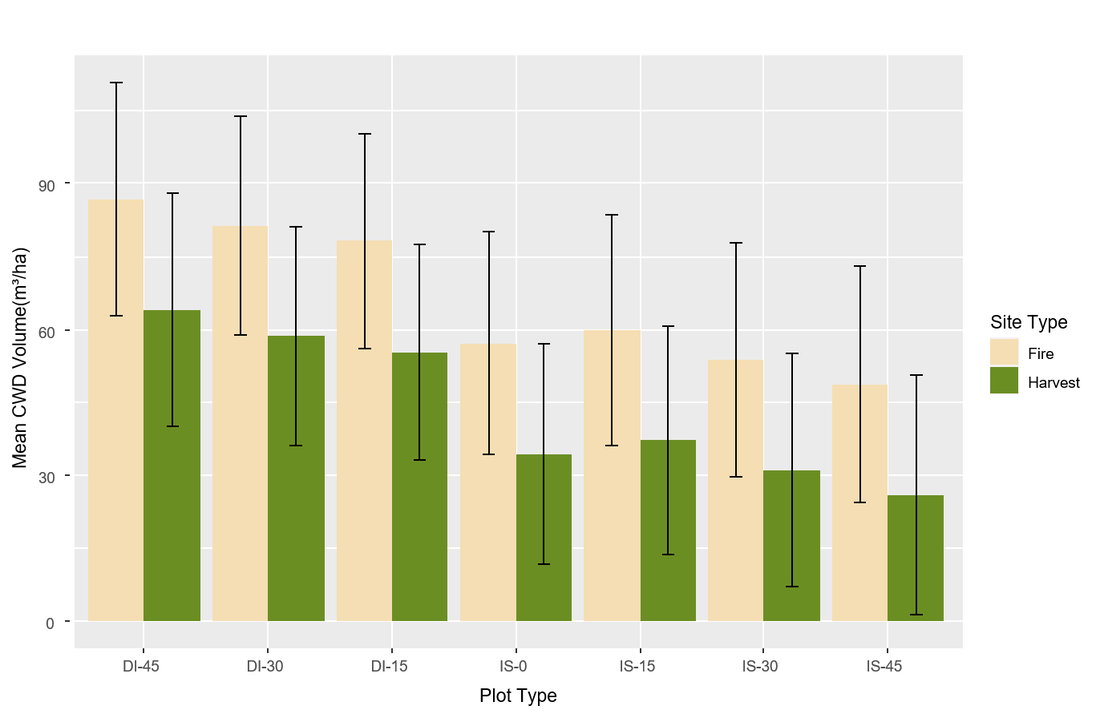
Plot 4. Standard error bar graph plotting the mean coarse woody debris volume to the different plot types in fire and harvest islands. DI refers to the Disturbance plots and IS refers to the Island plots. IS-0, IS-15 & DI-15 represents the edge plots where IS-0 is the edge point plot (half disturbance half island) of each site and 30,45 for both Disturbance(DI) and Island(IS) are the interior plots.
|
The coarse woody debris volume comparison in post-fire and post-harvest island remnants is depicted through standard error (SE) bar graphs, with means calculated using Estimated Marginal Means (EMMeans) and corresponding 95% confidence intervals (CI). EMMeans provide more precise estimates compared to individual means calculated using individual treatment or combinations. Notably, the analysis reveals a higher volume in the post-fire plots compared to post-harvest plots. However, a critical observation arises from the overlap of SE error bars across both harvest and fire plots. This convergence indicates a lack of statistically significant difference in volume between the two conditions. Despite the visual disparity in means, the consistent overlap in SE suggests that any observed differences may be within the expected variability. Therefore, the comparison does not achieve a statistically significant difference in the coarse woody debris volume in islands and disturbances, emphasizing the importance of considering the precision of estimates through the inclusion of SE and CI in the interpretation of coarse woody debris volume differences between post-fire and post-harvest island remnants.
|

Plot 5. Error bar line graph showing the trend of coarse woody debris volume throughout the plots. The DI refers to the Disturbance plots and IS refers to the Island plots. IS-0, IS-15 & DI-15 represents the edge plots where IS-0 is the edge point plot (half disturbance half island) of each site and 30,45 for both Disturbance(DI) and Island(IS) are the interior plots.
All the island plots in both fire and harvest shows a similar trend of comparatively higher volumes in the edge than the interior plots individually. When comparing between fire and harvest islands at each plots, they show a similar trend in the coarse woody debris volume distribution and the error bars overlapping represents there is less significant difference in the mean coarse woody debris volume. Therefore, it can be concluded that fire and harvest islands exhibit similar coarse woody debris volume along the plot distances. The disturbance plots show higher volume than the island plots. Comparing between disturbance plots the coarse woody debris volume increases from edge to interior. Moreover, the higher coarse woody debris volume in the edge plots in both islands can be noted as an edge effect from the disturbance(fire/harvest) occurred in the sites.
