SITE SELECTION
To locate potential study sites we used ArcMap and provincial fire data sets to find fires within the Upper Foothills Subregion that burned between 2005 and 2015, around the time that timber companies began to practice EBM in Alberta. In order to control as much as possible for similar composition between the harvest and fire sites, we used Alberta Vegetation Index (AVI) polygons to locate fires estimated to have burned in ≥50% lodgepole pine. After discarding fires in remote areas, we then used aerial imagery and DNBR raster layers to identify potential fire skips. We selected fire skips that overlapped or were adjacent to ≥50% lodgepole pine AVI polygons. To get a range of sizes for our sites, we narrowed our selection to skips between 0.3 and 5.0 Ha in size. This represents a similar size range to retention patches found in clear cuts, and is large enough to accommodate our sampling design. Through this process we located four fires that fit our criteria. We selected harvest retention patches according to the same parameters as the fire skips.
Because the number of potential harvest retention patches was much greater than the number of fire skips, we were able to narrow harvest areas that were accessible and relatively close to our fires in order to increase efficiency during the field season. Prior to the start of the field season, each skip or
patch was surveyed on foot or by drone to confirm species composition and islands that did not have a pine component were discarded.
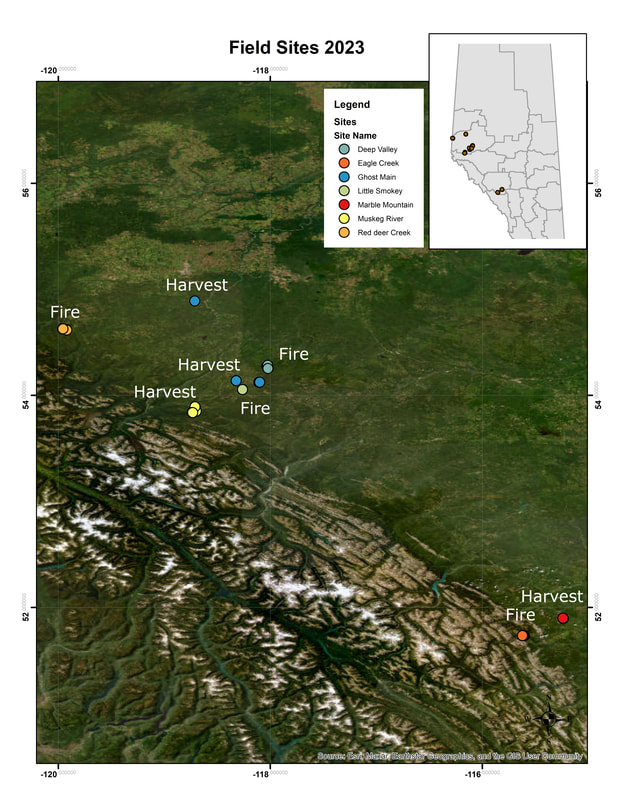
Fig 2. ArcMap study sites located in the Upper Foothill Natural Sub Region. Ghost Main harvest sites created in 2010, Marble Mountain in 2011 and Muskeg River in 2012 and Fires sites, Deep valley in 2006, Little Smokey in 2014, Eagle creek in 2009 and Red Deer Creek in 2014. A total of 14 harvest islands and 14 fire islands were sampled in the study.
PLOT LAYOUT
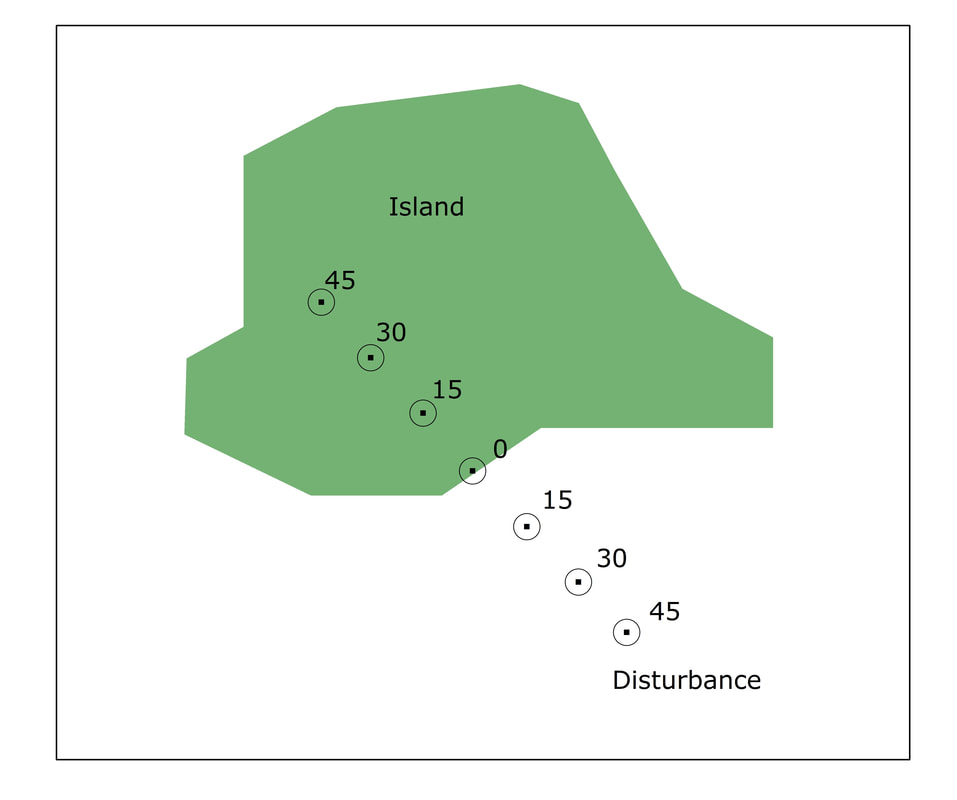
Fig 3. Sketch of a typical field site. The starting point or edge point is 0 and then 15, 30, 45 m to the island and disturbance in a line transect .
The sites were separated into 2 different areas, Island and disturbance. A bearing perpendicular to the forest edge is taken and a 45 m line transect with plot centers at 0, 15,30,45 m is established for the island and disturbance. There are three plots in each area which is along the transect at 15, 30 and 45 m from the edge and a common edge plot for both island and disturbance at 0(starting or edge point, Fig. 3). The starting points where generated using ArcMap and randomly selected using RANDBETWEEN function in excel. In harvest, we defined edge as the line halfway between standing trees and stumps and in fire, we defined edge as the midpoint between living and dead trees. At the plots six transect lines were strewn out at 0, 60, 120, 180, 240 and 300 degrees, declinating the compasses for each site. The plots were 14.6 meters in diameter.
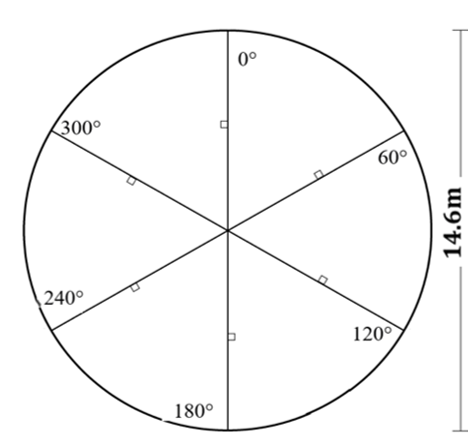
Fig 4. Line-intercept method transect setup. At each plot 6 transect lines were strewn out at 0, 60, 120, 180, 240 and 300 degrees, declinated for each location. Each transect line was 7.3 metres in length, meaning the length of two transects back to back equaled the diameter of the plot (14.6 metres). These transect lines served as the basis for whether a log would be counted or not.
COARSE WOODY DEBRIS SAMPLING CRITERIA
All coarse woody debris ≥ 7.5 cm diameter and > 1 meter long that crosses the transect at any point will be recorded and measured, then assigned a decay class and the species will be identified (if possible). Decay class will be determined using the 5-category class system based upon Pyle and Brown (1998). Coarse woody debris (CWD) includes down, dead tree and shrub boles, large limbs and other woody pieces. CWD that was angled at >45 were not counted as downed woody debris but counted as snags. Stumps rooted in the ground, bark not attached to a log, roots below the collar and very decomposed logs reduced to slightly elevated ‘humps’ on the ground without structural integrity were excluded from the survey. Standing dead tree information was gathered through typical forest inventory methods, walking around to the dead trees within the same plot, assigning a decay class, recording DBH and attempting to identify to the best of our abilities. Standing dead trees(snags) >9.1 DBH were included in this portion of the study.
Fig 5. Pictorial representation of decay classification for the downed woody debris and standing dead trees (Pyle and Brown ,1998).
