MASTER DATASHEETS
Data obtained for downed woody debris is processed in R and excel where the sum of the volumes each transect line is calculated (Marshall et al. 2000) and then the average of all 6 transect lines were found to estimate the total volume of each plot. For standing dead volume per plot the volumes were gathered using the DBH applied to the species-specific equations developed by Lambert et al. (2005). The individual volumes for each tree was summed according to plot and converted to m3/ha. Finally, the downed woody debris volume and the standing woody debris volumes were summed according to each plot to create a total coarse woody debris volume.
|
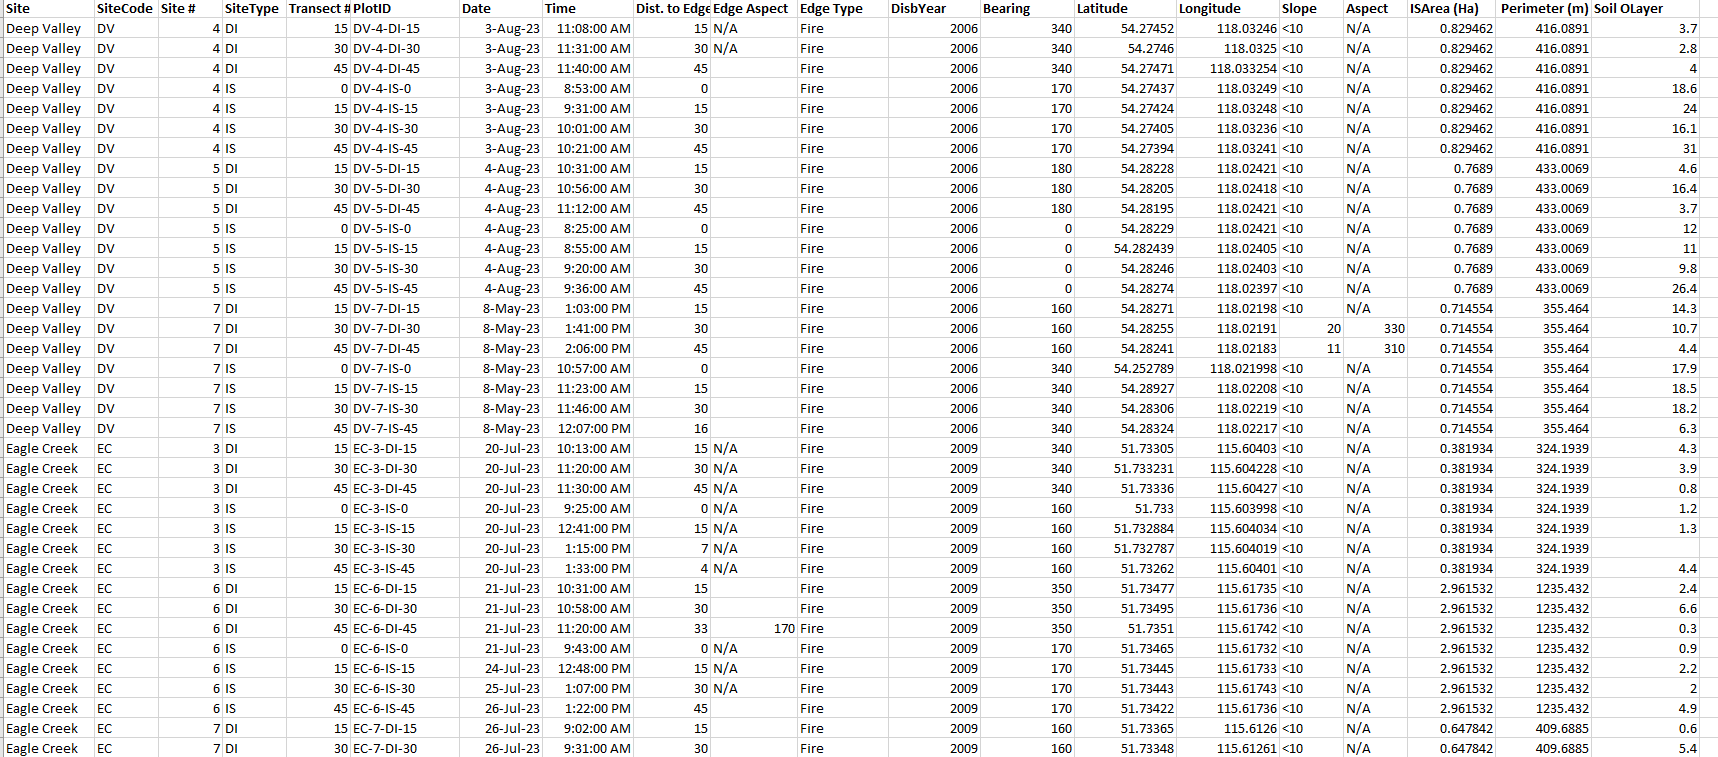
Table 1. Data set containing General information of every sites.
|
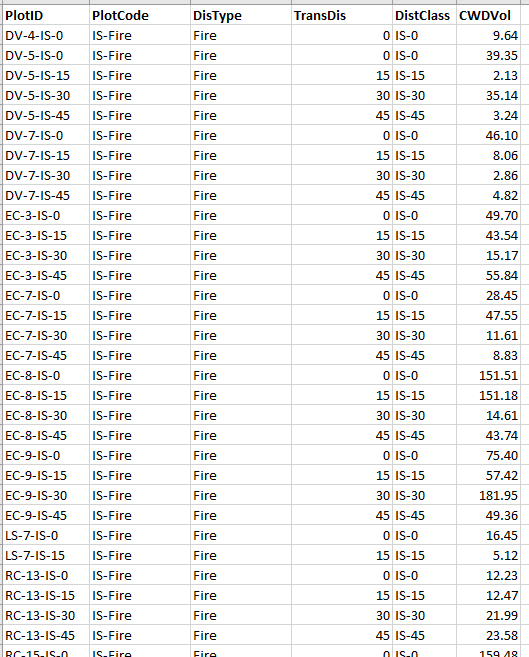
Table 2. Data set for coarse woody debris each piece recorded and data set after calculating total plot wise CWD volume. The volume of coarse woody debris volume per hectare for each plot is calculated as the average of the six transects in a plot(line intercept method). For standing dead volume per plot the volumes were gathered using the DBH applied to the species-specific equations developed by Lambert et al. (2005).Finally, the downed woody debris volume and the standing woody debris volumes were summed according to each plot to create a total coarse woody debris volume.
ATTRIBUTES AND SITE VARIABLES
PlotID : Unique ID of the plot
Site: Disturbance name, eg. “Eagle Creek” or “Muskeg River”
SiteNo: Island number from each site marked on the associated map
SiteCode: Short form for site name
DisType/Edge type: Disturbance Type (fire/harvest)
PlotType: Island/Disturbance plot
TransDis: Transect distance from the Edge(0,15,30 and 45 m).
Disturbance Year: Year in which disturbance occurred.
Dist. to Edge: Distance from each plot to the nearest edge. May be the less than or equal to the transect number, never greater.
Date: Date which plot was first established and first data recorded.
Time: Time when plot was first established and first data recorded.
Edge Aspect: Direction the edge is facing. Determined by taking a bearing perpendicular to the edge, facing the disturbance. Edge aspect is always the same as the transect bearing of a disturbance, or 180˚ from an island, unless there is an edge closer than the “0” plot. Measured to the nearest 10˚.
Bearing: The compass bearing along which the transect is drawn. The bearing for an island and its corresponding disturbance should be 180˚ apart.
Latitude and Longitude: To five decimal places. The GPS used at the plot center.
Slope : Slope angle, if >10˚, record the slope angle by using the inclinometer function of your compass or smartphone.
Aspect : Cardinal direction location of plots within an island.
Island Area : Amount of surface in each island (meters squared)
Perimeter :Length of the periphery of the island (meters)
Soil OLayer: Organic layer depth at each plot (centimeters)
DBH : Diameter at Breast height of each tree recorded(dead/live) in meters.
EXPLORATORY PLOTS
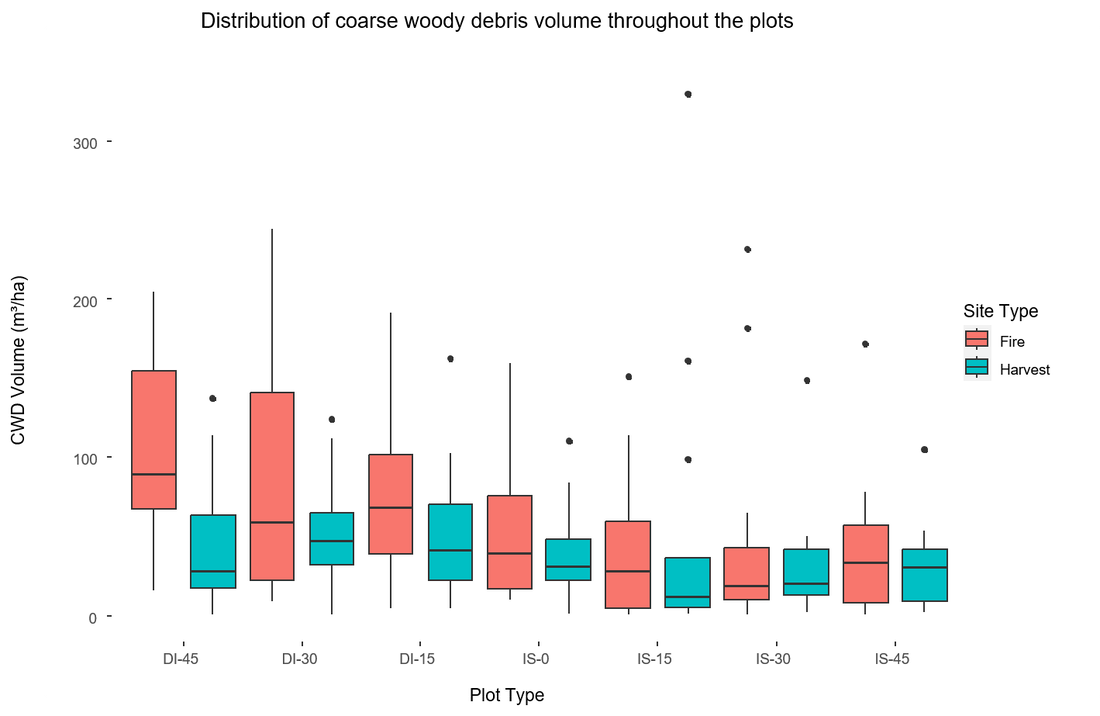
Plot 1. Boxplot displays the total coarse woody debris volume of decay classes 1-5 between harvest and fire islands from edge to interior of island and disturbance plots. The DI refers to the Disturbance plots and IS refers to the Island plots. IS-0, IS-15 & DI-15 represents the edge plots where IS-0 is the edge point plot (half disturbance half island) of each site and 30,45 for both Disturbance(DI) and Island(IS) are the interior plots. The fire plots show higher coarse woody debris volume compared to harvest plots.
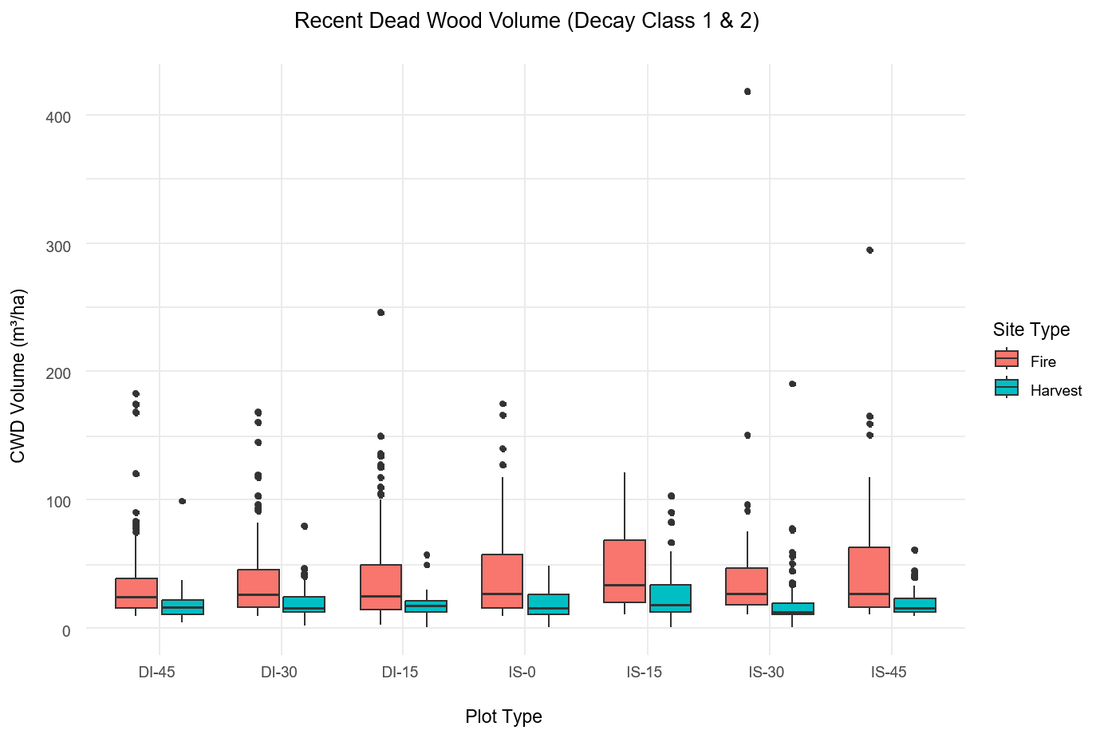
Plot 2. Boxplot shows coarse woody debris volumes of decay classes 1 and 2 compared between harvests and fire islands, according to the distance from the edge to interior of island and disturbance plots. The DI refers to the Disturbance plots and IS refers to the Island plots. IS-0, IS-15 & DI-15 represents the edge plots where IS-0 is the edge point plot (half disturbance half island) of each site and 30,45 for both Disturbance(DI) and Island(IS) are the interior plots.
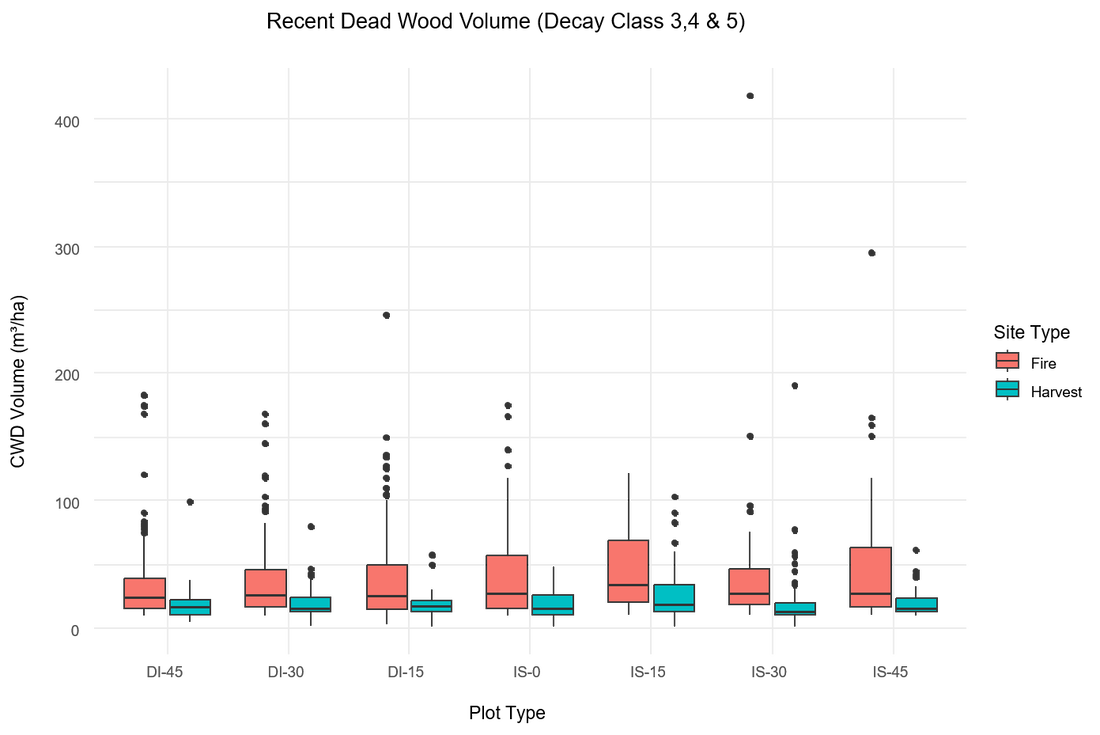
Plot 3. Boxplot shows coarse woody debris volumes of decay classes 3,4 and 5 compared between harvests and fire disturbances, according to the distance from the edge to interior of island and disturbance plots. The DI refers to the Disturbance plots and IS refers to the Island plots. IS-0, IS-15 & DI-15 represents the edge plots where IS-0 is the edge point plot (half disturbance half island) of each site and 30,45 for both Disturbance(DI) and Island(IS) are the interior plots.
Plots 2 and 3 display the coarse woody debris volume depending on the type of decay class. Since our project primarily concerns disturbances from approximately a decade ago, we won't be delving into the analysis of older decay classes (3-5). While there might be a correlation between various sites and older decay classes, our lack of investigation into these earlier disturbances prevents us from establishing their impact. As for the recent coarse woody debris comparison, the disturbances for fire had a larger amount of debris volume due to the methods of harvesting removal of a majority of woody material within the harvesting zone and also the fire sites have a large number of standing dead trees which is recently dead, belongs to decay class 1 and 2. Looking at the islands it is apparent that there is a larger amount of debris volume in island edges and the farther interior of fires compared to harvests. This is likely due to the characteristics of fires. In creating an island fires often drop from canopy to surface creating a gradient edge. In sampling the true edge is more convoluted than with a harvest, so it is likely that the larger volume of deadwood is due to edge placement and fire characteristics. Another possibility is the fires still had standing dead trees in the disturbance edge plots, so it is possible for those trees to fall into the island edge plot and be double counted. This is not possible with harvests because of the lack of trees in the disturbance areas.
